P6-Reporter
Case Studies News Videos Survey ResultsBlogsKnow how your projects are progressing with convenient, easy to understand reporting. Whether you prefer Oracle Data Visualization, Power BI or Tableau - Emerald Associates has got you covered.
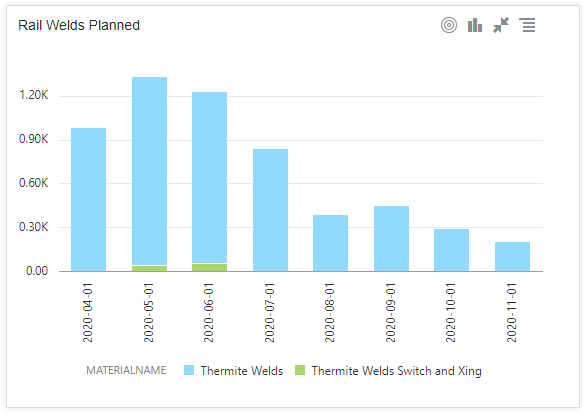
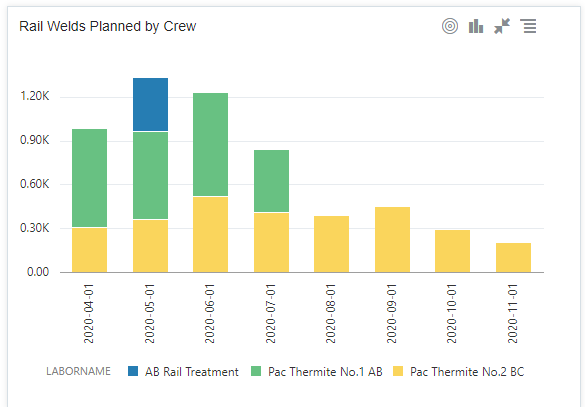
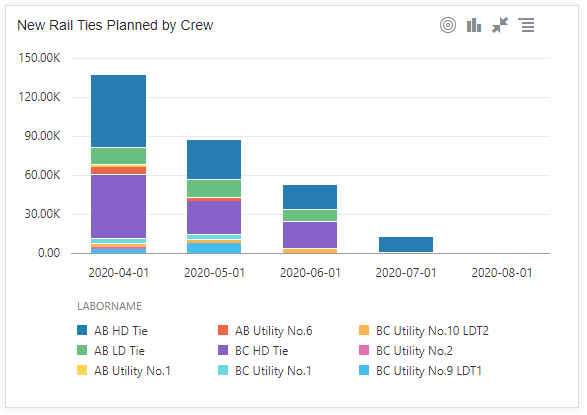
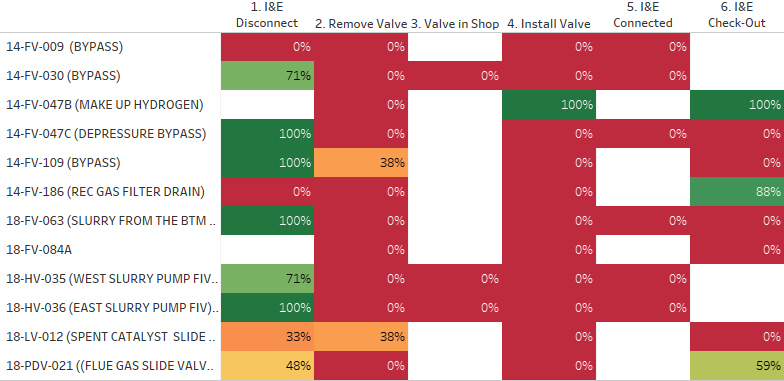
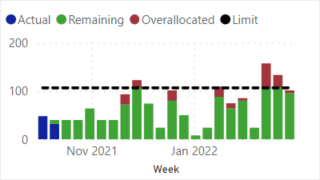
Workdown Curve
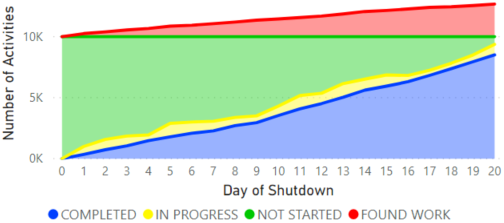
See how your activities are progressing across your shutdown: how may are completed, in progress, and have been added.
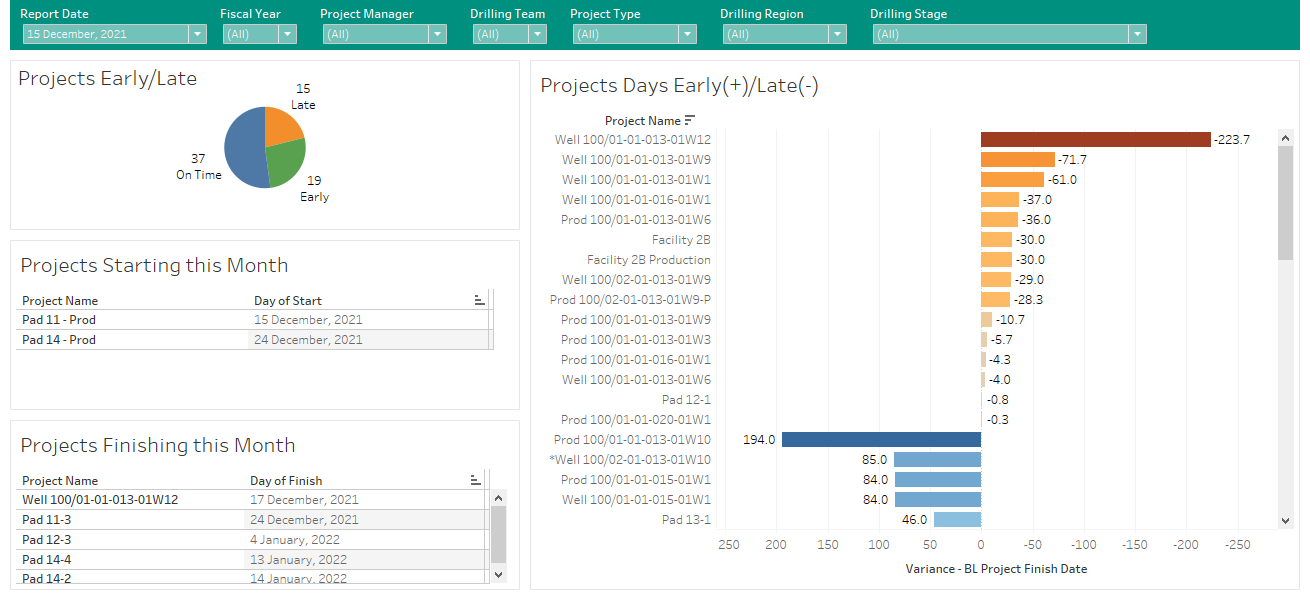
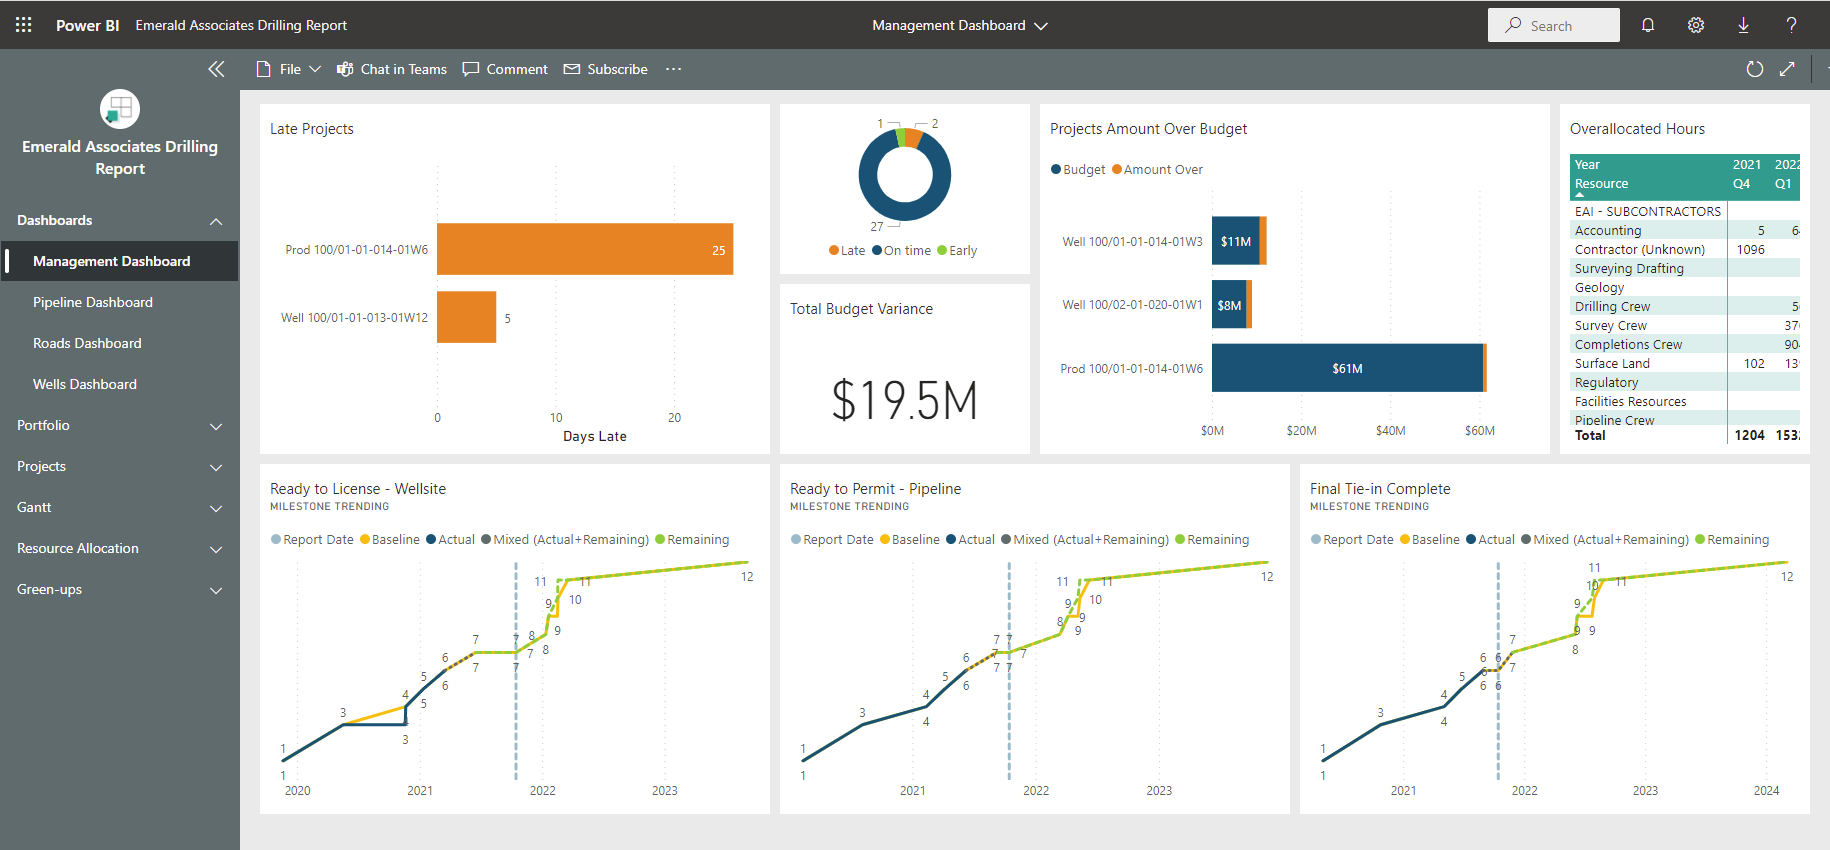
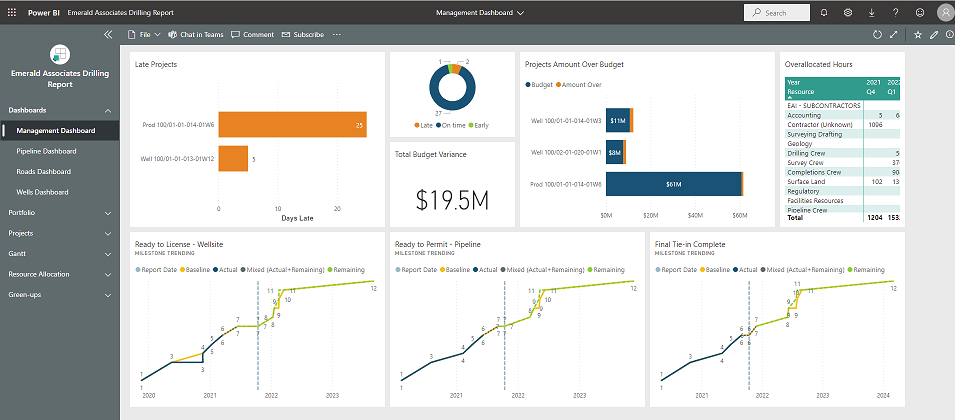
P6-Reporter is a powerful reporting solution designed to make project data from Primavera P6 accessible, visual, and actionable. Developed by Emerald Associates, this tool helps project teams transform complex scheduling and resource information into clear, customizable dashboards and reports.
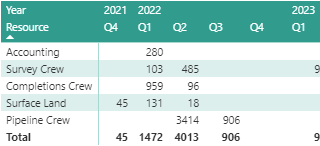
With P6-Reporter, you can integrate your Primavera P6 data with leading business intelligence platforms such as Microsoft Power BI, Tableau, or Oracle Data Visualization. This integration allows you to build interactive reports that highlight project performance, schedule health, resource allocation, and cost trends. Instead of relying on static reports or time-consuming manual data exports, P6-Reporter provides a dynamic view of your project portfolio.
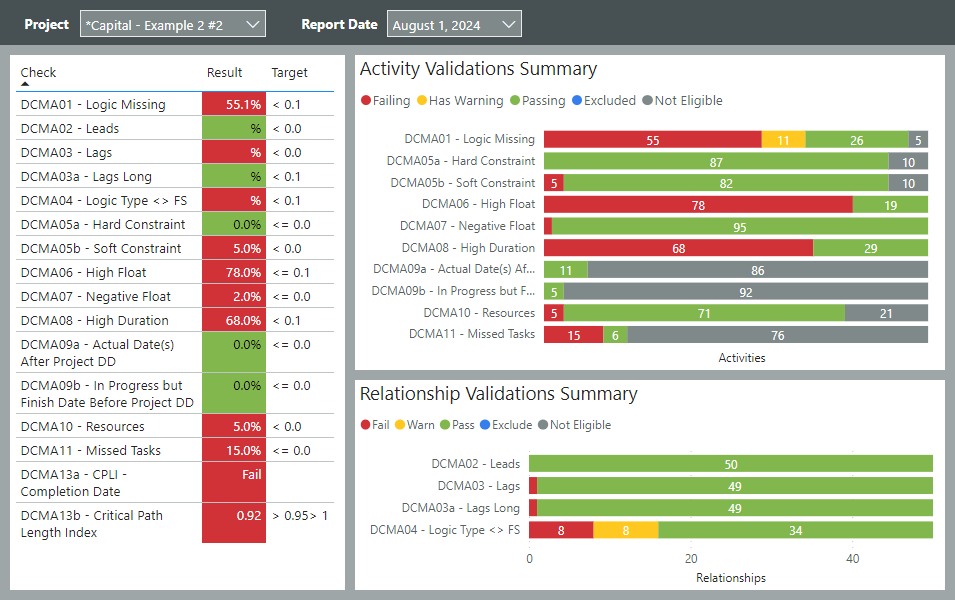
The solution supports a wide range of reporting needs, from high-level executive dashboards to detailed scheduler and project manager reports. Teams can monitor KPIs, identify risks, and communicate results more effectively with stakeholders. P6-Reporter also offers flexibility to tailor dashboards to match organizational requirements, ensuring that the right people see the right data.
Whether you are overseeing a single project or managing a large portfolio, P6-Reporter helps you to improve visibility, streamline reporting processes, and make better, data-driven decisions across your project lifecycle.
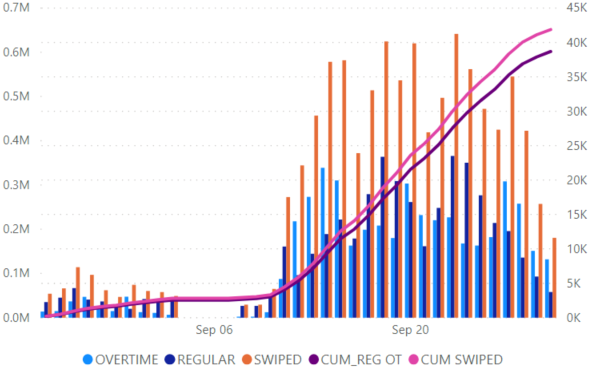
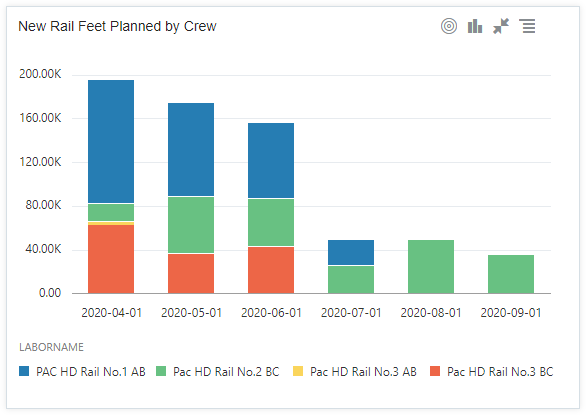
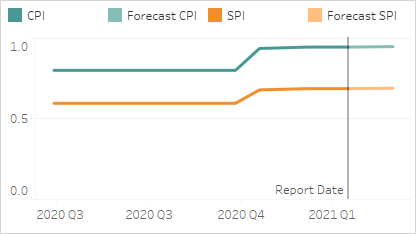
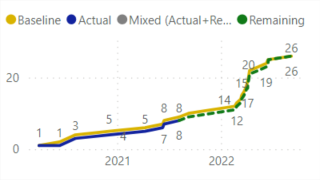
S-Curve Turnaround
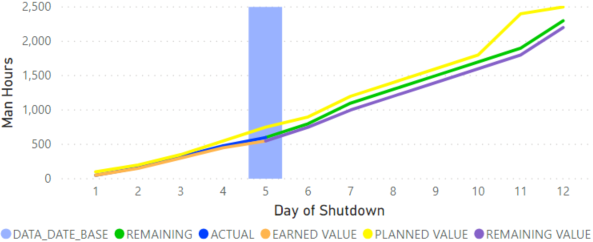
View how many man-hours are planned and how many have been spent on your turnaround.
P6-Reporter is a powerful reporting solution designed to make project data from Primavera P6 accessible, visual, and actionable. Developed by Emerald Associates, this tool helps project teams transform complex scheduling and resource information into clear, customizable dashboards and reports.
With P6-Reporter, you can integrate your Primavera P6 data with leading business intelligence platforms such as Microsoft Power BI, Tableau, or Oracle Data Visualization. This integration allows you to build interactive reports that highlight project performance, schedule health, resource allocation, and cost trends. Instead of relying on static reports or time-consuming manual data exports, P6-Reporter provides a dynamic view of your project portfolio.
The solution supports a wide range of reporting needs, from high-level executive dashboards to detailed scheduler and project manager reports. Teams can monitor KPIs, identify risks, and communicate results more effectively with stakeholders. P6-Reporter also offers flexibility to tailor dashboards to match organizational requirements, ensuring that the right people see the right data.
Whether you are overseeing a single project or managing a large portfolio, P6-Reporter helps you to improve visibility, streamline reporting processes, and make better, data-driven decisions across your project lifecycle.
Case Studies
P6-Reporter Used to Capture and Report on P6 Data

Emerald Hosts Primavera P6 for US Engineering Company

P6 Upgrade, Implementation and EAI Tools

Large Engineering Firm Moves to EAI Hosting

P6-Calculator and P6-Reporter Makes Power BI Reporting a Breeze

Integrated Daily Cost Control - Discoverer to P6 and PCM

Large US Refinery Implements Emerald Tools

Why I No Longer Dread Morning Management Meetings on a Turnaround Project
See Case Studies for all tools... Back to top
News
P6-Reporter v3 - New Release
More charts. More insight. Understand your projects in ready to use, customizable reports in Power BI, Tableau or ODV.
Videos


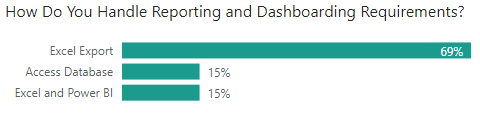
Webinar Survey Results

 Back to top